Business Intelligence

With us, you'll discover the true value of information and data. Connect data from different sources and visualize it in the form of "live" interactive reports and dashboards.

Why Business Intelligence?

Many companies still don’t realise the true value of the data and information they hold, so we bring you Business Intelligence to process your data into reports that will drive your business growth.

Have all essential information about your business in one place. Stop clicking from one system to another.

Business Intellegence is a solution where we process your business data into clear and visually appealing reports (pozor tam je link) , freeing you from large MS EXCEL spreadsheets. We will create a series of interactive reports where your managers, technologists, operators, etc. will get an overview of the current state of the company and their activities, leading to more effective decisions.

Microsoft Power BI

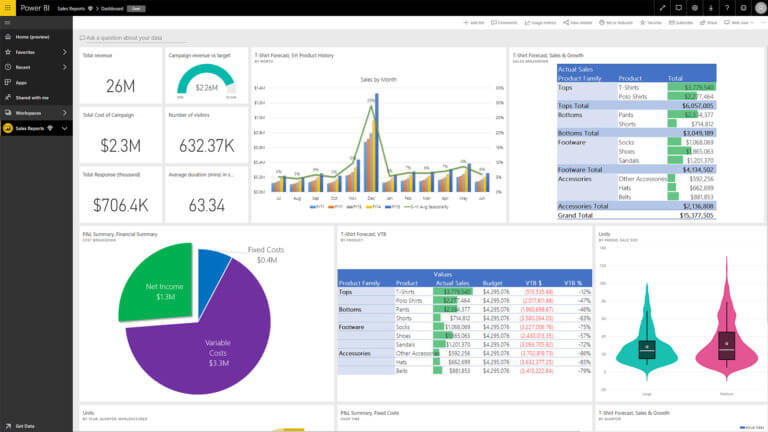
We are a proud Microsoft partner and our analytics are built on the Microsoft Power BI platform, which enables intuitive data handling and offers a wide range of analysis, visualizations and reports.

The main advantages of Microsoft PowerBI:

  • Can run in the cloud or on your internal server
  • Easy data integration and linking to third-party applications

The Business Intelligence is not only about to provide a fancy visualisation of your data, but also to provide you a tool for your planning and forecasting processes.
Together with Machine learning and AI we can help you design forecasts you can modify as you need or just let them run and to their job.

Try the POWER BI reports

Take a look at our Power BI report samples from various business areas. Try the functionalities of Power BI reports and be inspired by a wide range of data visualizations for the management reports.

Human resources

Retail

Opportunity Analysis Report

Supplier Quality Report

How you can leverage your data
for the development of your business?

Benefits of implementing a BI application for reporting:

1

Automatic processing of data from various sources (IT, GPS, ERP, CRM, HR systems, attendance system, Support line and helpdesk, Warehouse management, Accounting, Billing, etc.);

2

Company KPI metrics to track not only finances, but also production, logistics, and the performance of your employees.

3

Analyses and reports for strategic decisions and company management

4

Access reports anytime, anywhere (online application)

5

You get real and actionable management reporting

6

Clear information about your operations, business units, centres in one place

7

Easy access to data and information

8

Visually attractive, clear and user-friendly reporting.

How to use Business Intelligence to your advantage, whether you are a small local business or a multinational corporation?

Small local company

shop + eshop

Data sources:
  • accounting system and invoicing
  • Warehousing
  • e-shop data (traffic, orders)
  • online marketing (google, FB)
  • ERP

Using Reporting: Daily data updates and profitability tracking of sales channels (store, eshop), item segmentation and categorization (layers, quick turnarounds). Find out which products sell better in store and which ones sell better via e-shop. Don’t tie up funds in high inventory, but track optimal inventory levels and forecast consumption on a daily basis.

Medium-sized company

engineering company with one production hall

Data sources:
  • accounting system and invoicing
  • Warehousing
  • CRM
  • GPS
  • machine pull-out counters

Use of Reporting: Daily data updates and profitability tracking of individual production centers. You will get information about your business partners, their payment discipline and their compliance with delivery deadlines to your warehouse. Gain insight into the utilization of your machines and plan investments where they are most needed. Support your sales team with insightful information on their customers’ activity, consumption, order frequency and get an overview of the work of your sales representatives. Where do they spend most of their time? How much time do they spend travelling and what is their profitability ? better in-store and which through the e-shop. Don’t tie up funds in high inventory levels, but track optimal inventory levels and forecast consumption on a daily basis.

Corporations and large companies

a network of 60 sportswear stores in the Slovak Republic, Czech Republic, Poland and Austria

Data sources:
  • accounting system and invoicing (IFRS standard)
  • Warehousing
  • CRM
  • GPS
  • logistics and own transport
  • attendance system
  • helpdesk
  • online support line, etc.

Use of Reporting: Consolidate accounting data into a single and clear management system. Track the performance of individual operations by region and country. What is the customer satisfaction rate in the regions and the proportion of complaints to sales. Gain insight into the quality of complaints and helpdesk services across countries. Segment sales items and optimize them. Track logistics and distribution center/vehicle utilization. What is the employee turnover at the outlets and employee satisfaction etc.

What do you get by working with us?

As part of the BI application integration for reporting you will get:

We will personally introduce you to the application and its practical use